Plot recovered basis functions from a MetaHunt fit
Usage
# S3 method for class 'metahunt'
plot(x, x_axis = NULL, ...)
Arguments
- x
A
"metahunt"object frommetahunt().- x_axis
Optional numeric vector of length
G_gridgiving the x-axis values. Defaults toseq_len(G_grid).- ...
Passed to
graphics::matplot().
Examples
set.seed(1)
G <- 25; m <- 40
x_grid <- seq(0, 1, length.out = G)
basis <- rbind(sin(pi * x_grid), cos(pi * x_grid), x_grid)
W <- data.frame(w1 = rnorm(m), w2 = rnorm(m))
eta <- as.matrix(W) %*% cbind(c(1, -0.8), c(-0.5, 1.2), c(0, 0))
pi_true <- exp(eta) / rowSums(exp(eta))
F_hat <- pi_true %*% basis + matrix(rnorm(m * G, sd = 0.05), m, G)
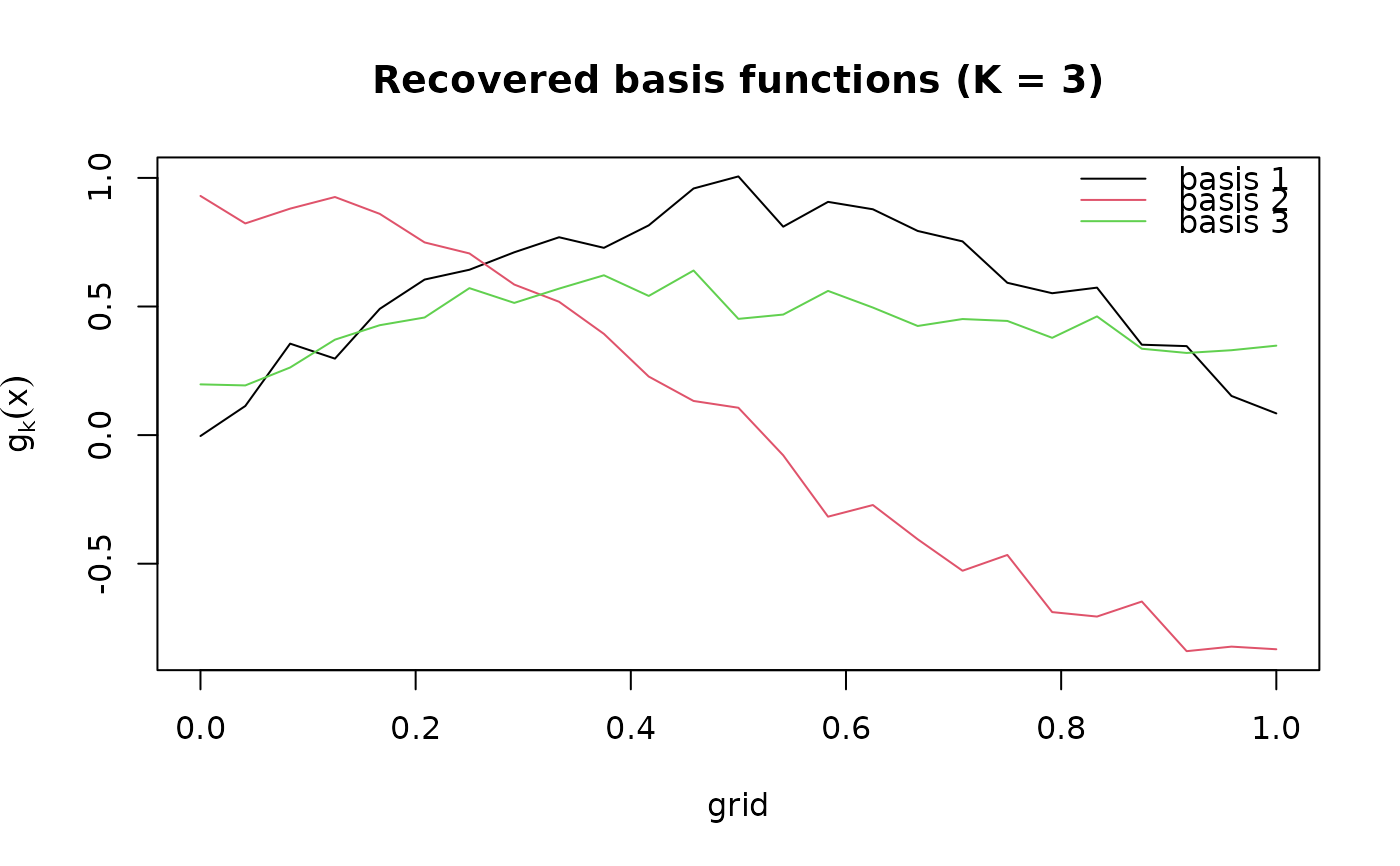
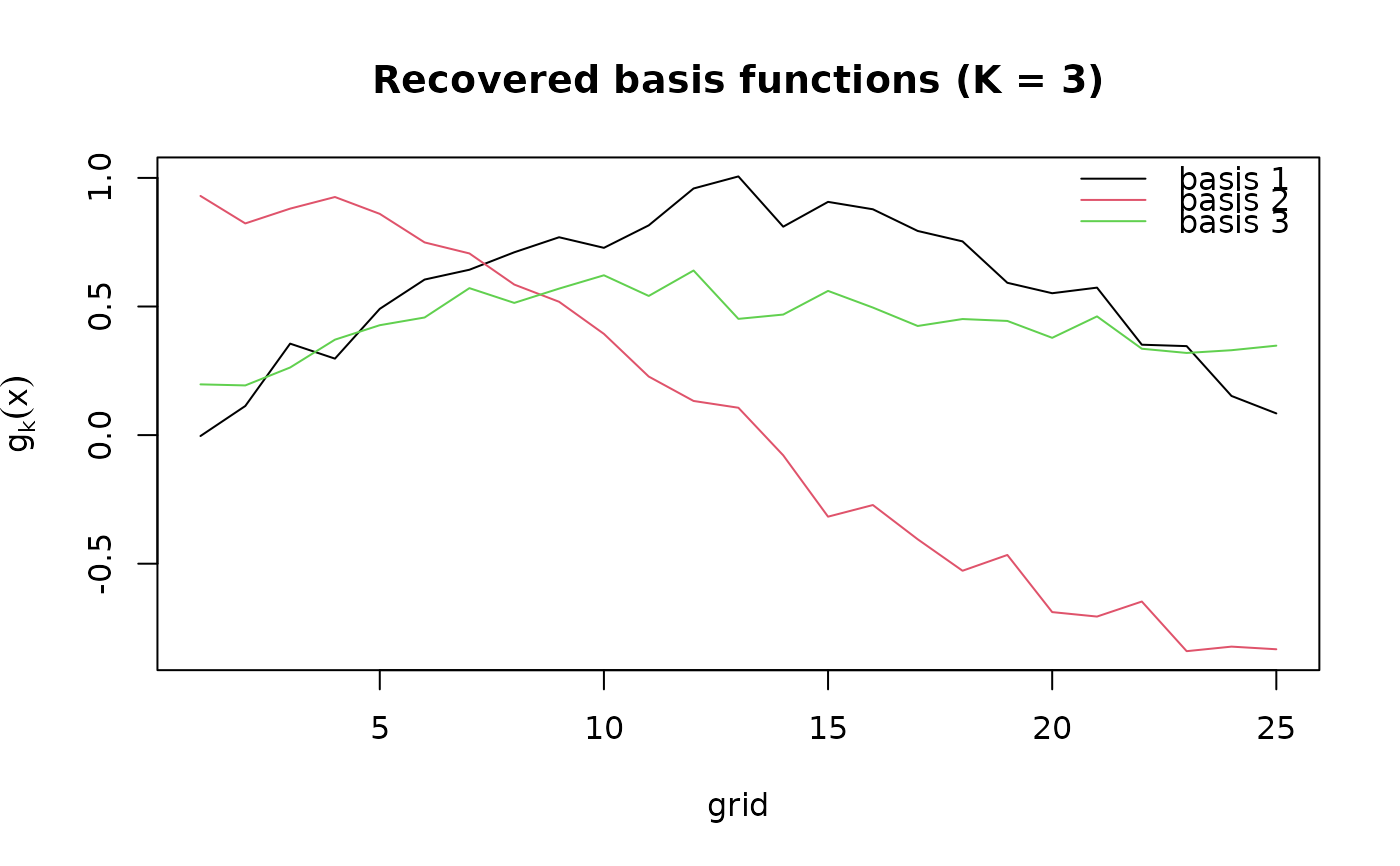
fit <- metahunt(F_hat, W, K = 3, dfspa_args = list(denoise = FALSE))
plot(fit)
 plot(fit, x_axis = x_grid)